Attendance analytics help you understand whether booked time turns into completed work.
Attendance tracking is off until an organisation switches it on in settings. With it on, one view shows booked, attended and no-show trends per service, so you can react before the pattern hurts your schedule.
What to monitor first
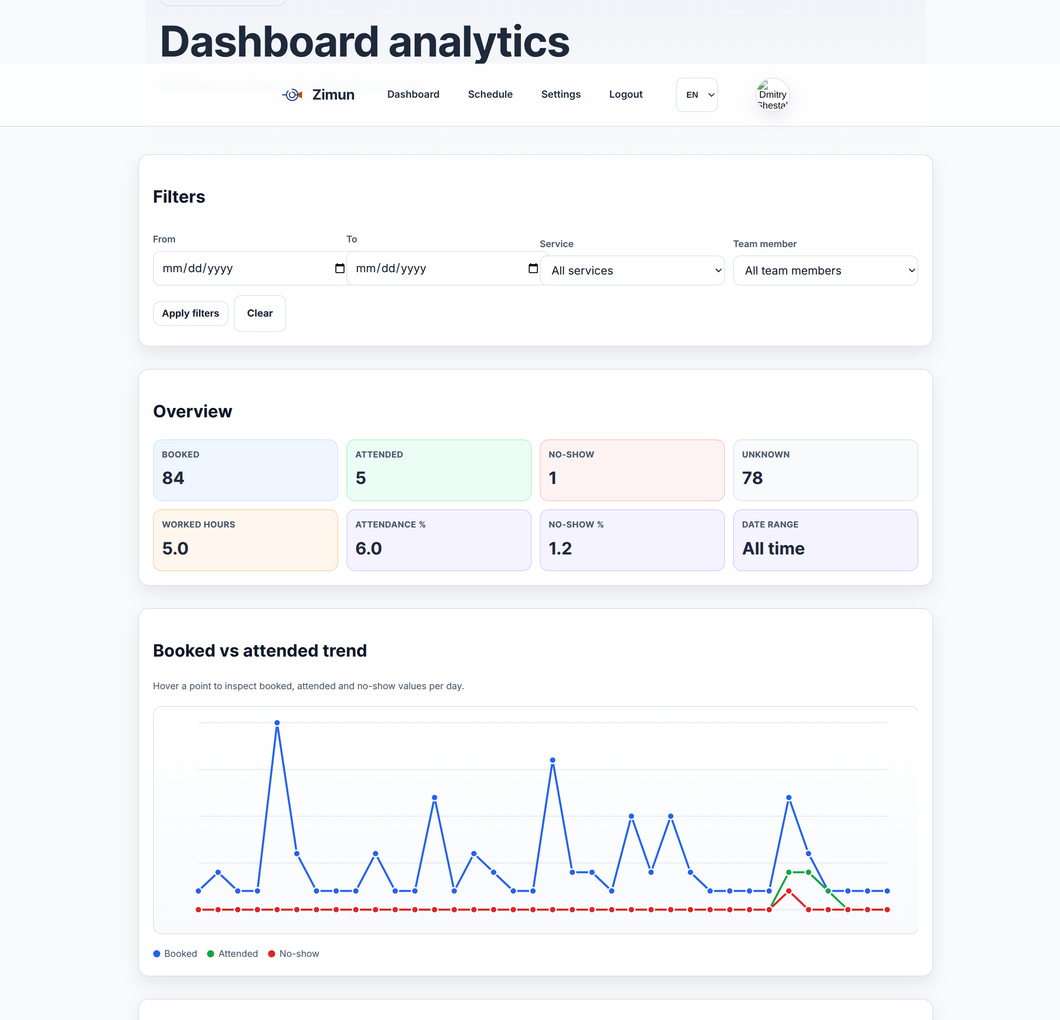
- Booked vs attended trend by day to detect changes early.
- No-show levels over time to spot communication or timing issues.
- Attendance rate after filter changes (service, date range).
How to read the trend chart
The chart compares three lines: booked, attended, and no-show. Hovering each point gives exact values for that day.
When booked remains steady but attended drops, the issue is usually reminder quality, timing, or customer expectations.
How to mark attendance
- Open Dashboard schedule and click an appointment to open details.
- Use Mark as started and Mark as ended as the appointment runs. Attendance follows from those times, so there is no separate attended button. Mark no-show records that the customer did not turn up.
- Attendance updates immediately and is reflected in analytics totals and trends per service. Schedule load per team member counts booked hours only and never shows attendance.
Start with Last 30 days, then compare This month and This quarter presets. Narrow to one service to isolate the root cause.
Common decisions this supports
- Adjust reminder timing for services with elevated no-show rates.
- Shift high-risk slots away from low-attendance days.
- Spot when a single service has lower completion than the rest of the business.
Open the dashboard at Dashboard analytics to apply filters and review current attendance behavior.